What Makes a Country Happier?

Summary
I analyzed the World Happiness Report to understand which factors (GDP, social support, freedom, generosity, corruption) influence happiness across countries. Using PCA and factor analysis, I found that economic well-being, social support, and trust in institutions are the strongest dimensions behind happiness rankings.
About the Data
The World Happiness Report ranks countries by average happiness scores based on global surveys. The dataset includes one row per country per year, with features like GDP per capita, social support, life expectancy, freedom, generosity, and perceptions of corruption.
Data source: World Happiness Report
Methods
I started with exploratory visualizations to understand feature relationships and happiness trends across regions. Then I applied PCA to reduce dimensionality and uncover dominant patterns, followed by Factor Analysis to identify underlying factors like economic well-being and social trust.
Evaluation
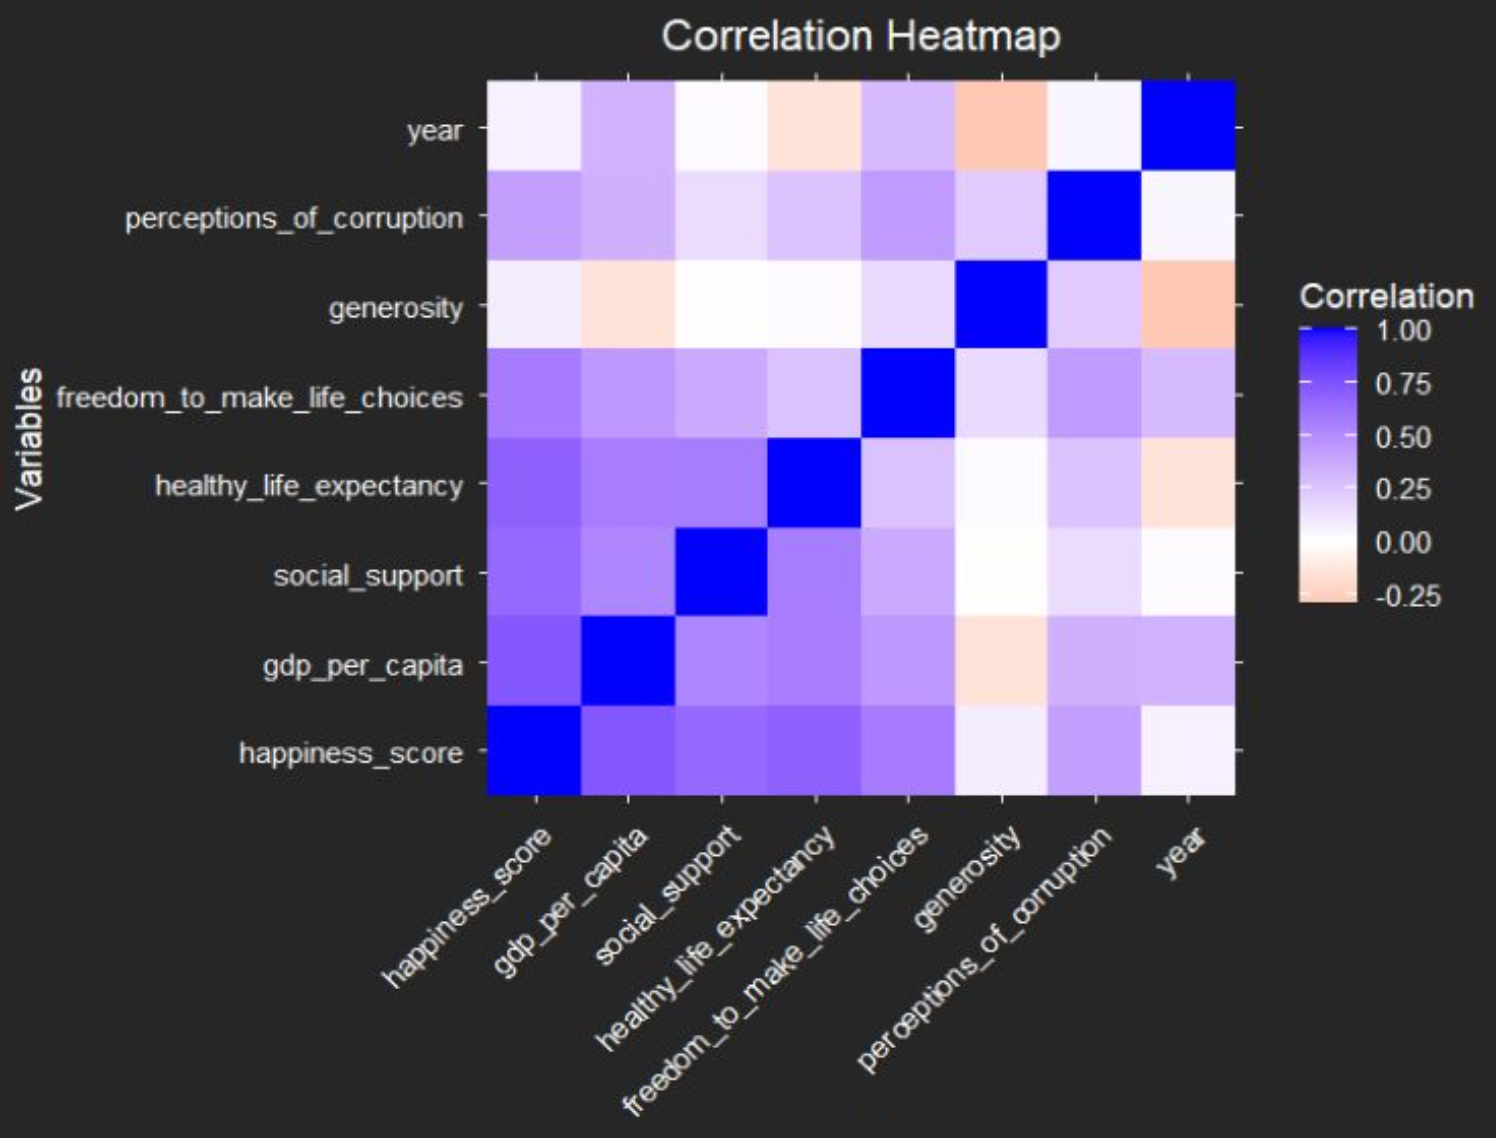
GDP per capita, social support, and life expectancy show moderate to strong positive correlations. Freedom also helps, while generosity is weakly correlated and not always tied to wealth.
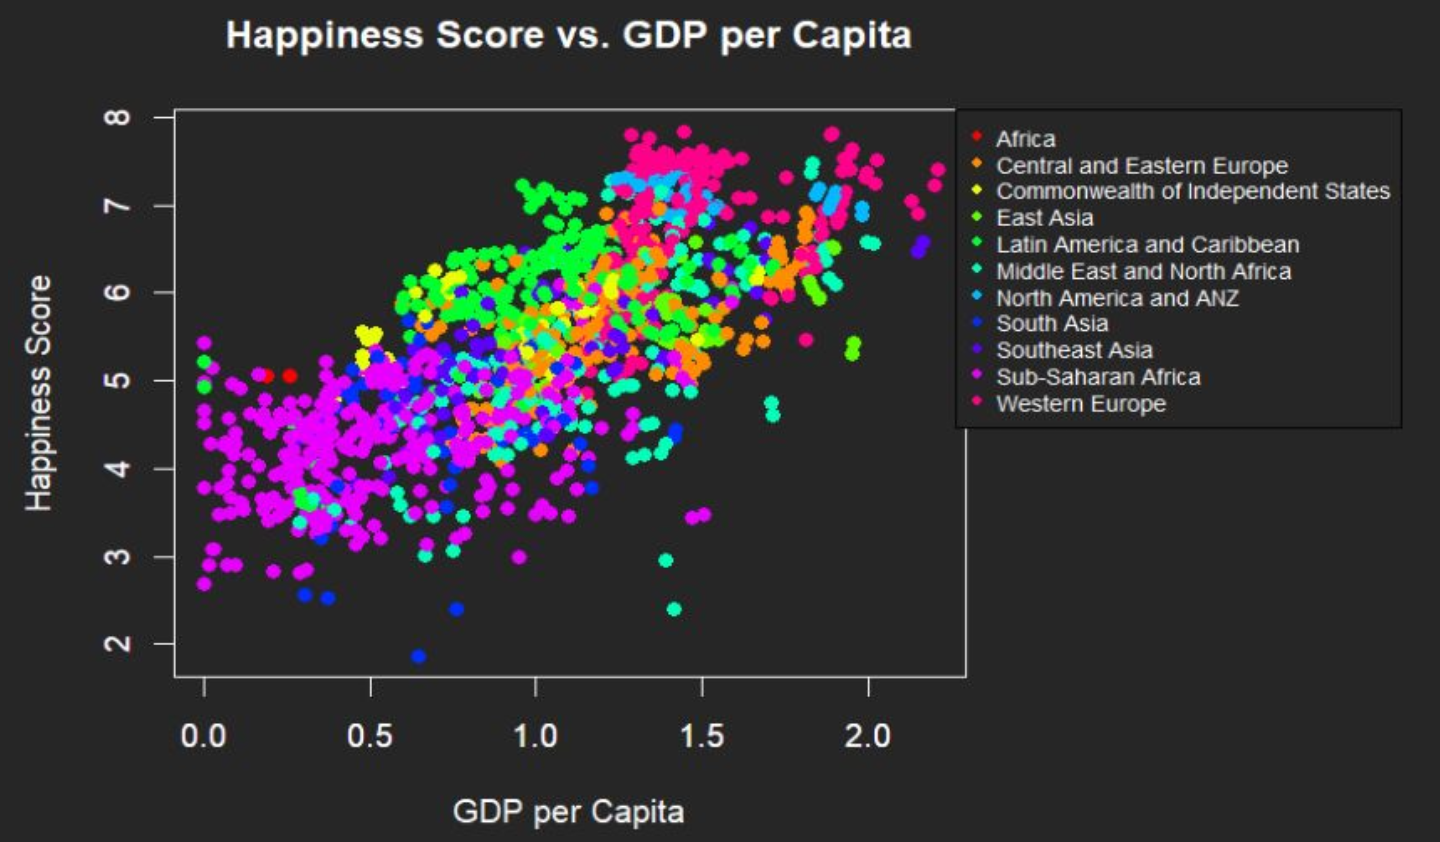
Western Europe and North America cluster at the high end of GDP and happiness. Sub-Saharan Africa and South Asia cluster lower, reflecting the impact of economic challenges.
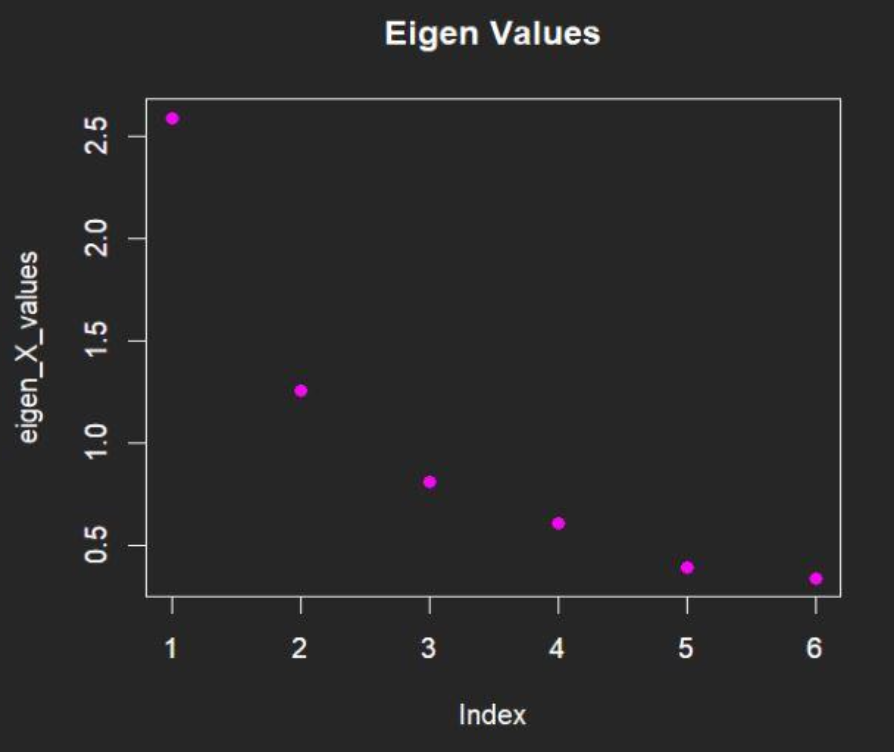
What did PCA reveal?
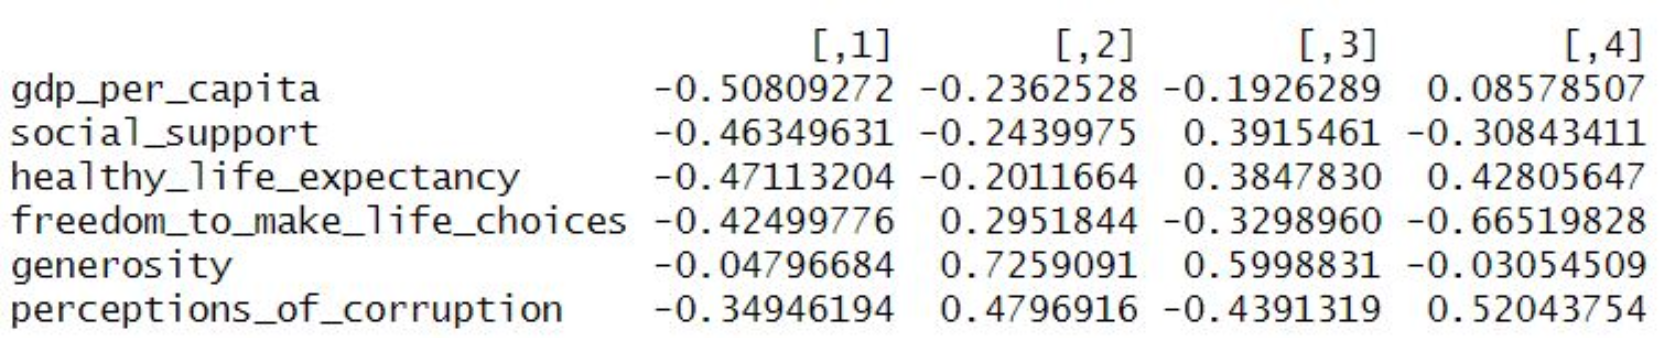
The first 4 principal components explain ~88% of variance. PC1 captures economic well-being & social support, PC2/PC3 capture trust in governance and selflessness, PC4 highlights personal freedom.
What about factor analysis?
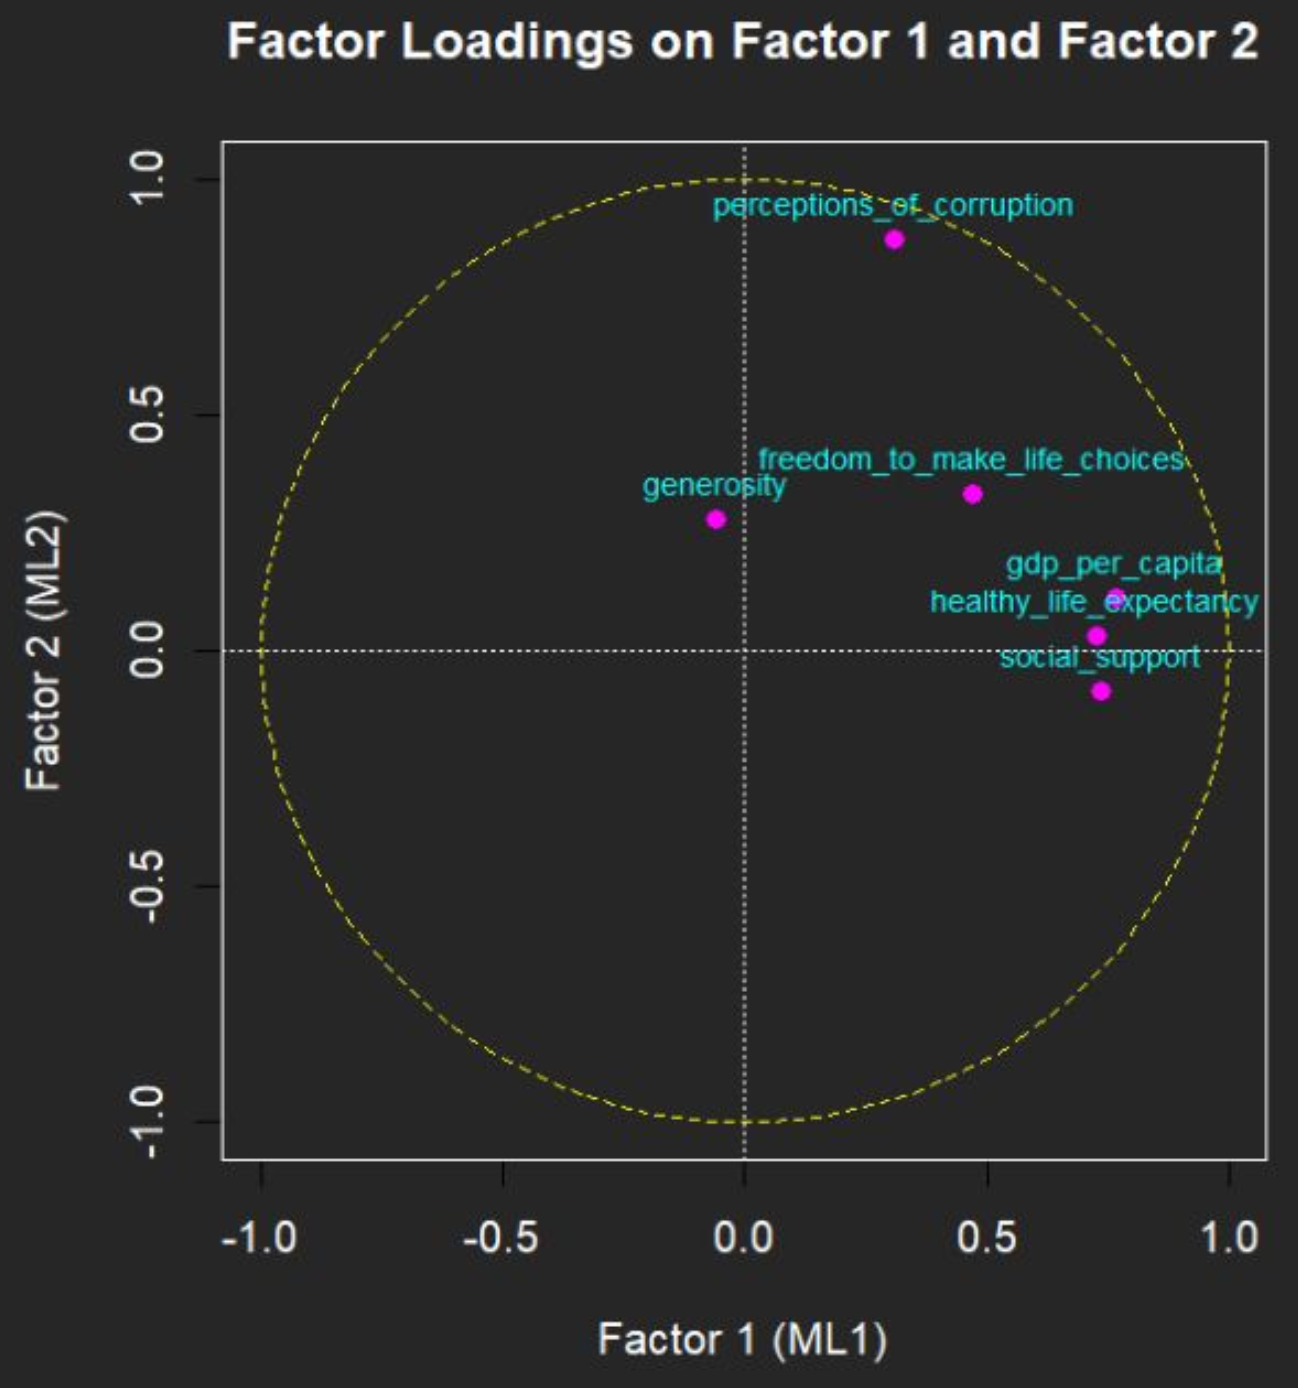
Factor analysis grouped variables into two main dimensions: (1) economic well-being & social support, (2) social trust & governance quality.
Insights
Both PCA and Factor Analysis reveal similar patterns in the data. The first principal component and the first factor both highlight the importance of economic well-being and social support. The second component and factor relate to perceptions of corruption. However, generosity behaves differently—while PCA links it to PC2, Factor Analysis shows it has high uniqueness, suggesting that generosity may be influenced by other factors not captured in the dataset.